Background
Numeric is a $34.7B quantitative asset management firm founded in Boston in 1989. In 2014 they were acquired by The Man Group, making them Man Numeric.
The Client Services team at Man Numeric is responsible for fielding inquiries via the global Man Group sales team relating to client requests. Post acquisition, their workload has grown dramatically.
Man Numeric came to us with the challenge of designing a two-sided web app to allow for;
Sales people to submit inquiries to Client Services
Client Services team to track and manage inquiries once received
Role & time
Jan-Feb 2019 | 3-weeks
4-person design sprint - Personally responsible for;
hi-fidelity mock-ups
project management
stakeholder communication
comparative analysis
interview discussion guide
user interview lead
Tools
Sketch, InVision, Adobe XD, Zoom
Research
Understanding Asset Management
Our team had backgrounds in film, education, psychology, customer experience, and sales. That is to say, quantitative asset management was not a part of daily vocabulary prior to this project.
To kick off our process, we familiarized ourselves with the industry to better understand the role of the Client Services team and the problem they were experiencing.
During this phase we took note of industry specific language to reduce the amount clarifying questions that had to be asked during interviews. We worried pausing often would eat up valuable time with remote users who had busy schedules and hard stops.
User Interviews
Once aquatinted with the industry and it’s lingo we conducted seven interviews;
Internal User X1
External User X4
Stakeholder X2
Our interview questions were focused around gaining a deeper understanding into the current workflow for submitting and receiving inquiries. In doing this we uncovered the goals, needs, and frustrations of our two main users, the Client Services agent and Sales Person.
Synthesis
We needed to design a separate login and interface for both the Global Sales team and the internal Client Services team.
So when it came down to making sense of all seven interviews we decided to create two separate affinity maps - one for each of the two main user groups, Sales people and Client Services agents.
Doing this allowed us to draw clearer insights from each user group than we would have been able to with a large amalgamated map.
So, what did we hear from users?
Design
Click to expand
Sketching & Wireframing
To kick off the design portion of this project, we conducted a quick MoSCoW Method analysis to determine the key user needs and corresponding features we should focus on moving forward.
We each then diverged for an evening to individually created sketches based on interview synthesis. We converged the next day and shared our sketches and the thinking behind them.
Having limited access to key users due to geography and time differences meant we needed to make the most of our time when presenting designs for feedback. I advised that our quickly move from sketches to low-fidelity mockups. We did not have the luxury of multiple sessions with each user, progressing from paper prototypes up through hi-fi.
Missing the Mark
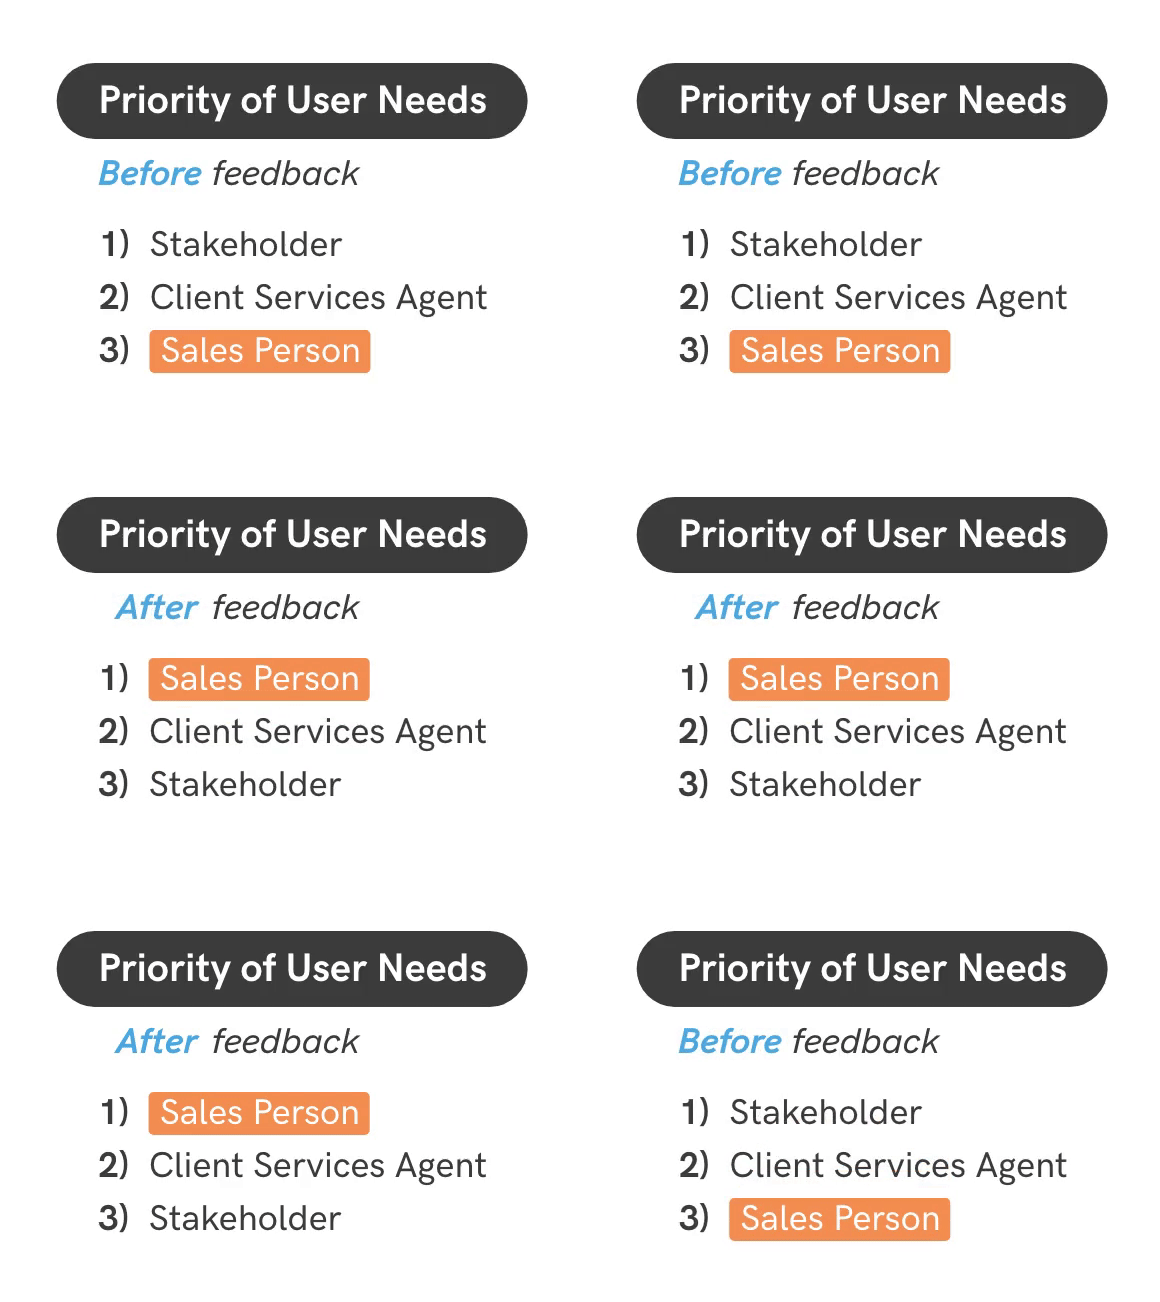
We presented our client stakeholder with the initial wireframes and quickly realized we had missed the mark, almost entirely.
Instead of designing features to make our daily users more efficient in their workflow, we had devoted much of our time designing data visualization features for our stakeholder.The catch-22 is that these data visualization would never become functional until we solved the crux of the problem; creating an inquiry submission environment that delivers value to sales people (No sales submissions = No data to visualize).
How could we have been so off? Well, we began this project with a 2hr long kick-off session with our stakeholder. We realized we had allowed what we heard in that initial session to outweigh what we heard from our daily users, the internal Client Services agent and the external Sales person.
Regaining our footing
To deliver a successful solution we needed to reorient our thinking, putting the needs of the external Sales person first.
We quickly pivoted our feedback meeting to a participatory design session - allowing our client to quickly sketch some key Sales features while vocalizing his thought process. This was a massive turning point in the project.
From this exercise we uncovered insight into “value-adds” for Sales people that could be incorporated alongside the inquiry submission form - Essentially, additional reasons for Sales to engage with the new tool.
Click to expand
Designing for Sales
With a renewed focus on delivering value to Sales people we created iterated on our wireframes to incorporated learnings from the client feedback / participatory design session.
The new interface (shown to the left) has three distinct areas;
A form to submit inquiries
An area to view submitted inquiries status
An area for value-adds
Examples of Value-adds
Interactions designed in Adobe XD
In the context of project, value-adds for Sales were a mix between features that provided utility and features that motivated. What does that mean? Well, below are a few examples that might help explain;
Travel Schedule
the ability to see the travel schedules for key Numeric Portfolio Managers (PM) gives Sales the opportunity to set up meetings between clients and PMs when they both are in the same area - meetings that could make the difference between won and lost business
Daily Performance Charts
seeing the daily performance of various Numeric investment strategies gives Sales important information about client sentiment before jumping on calls or in-person meetings
Global Sales Rankings
showing how much Numeric investment product different Man Group offices have sold helps to create healthy competition between offices and brings curious Sales people into the tool
Iterations
Without the opportunity to conduct in-person or remote usability tests, most of our iterations were based on feedback from our client and remote interviews with our daily users to test high level feature concepts.
Final Mockups
Sales Dashboard
Client Services Dashboard


